Fukushima Daiichi Nuclear Power Plant Accident Analysis due to Atmospheric Dispersion
Language: English / Japanese
1. Summary
This study shows simulation results of 137 Cs
deposition released from Fukushima Daiichi Nuclear Power Plant
Accident on March 12, 2011.
Simulation from March 11th to April 6th, 2011 was conducted and
137Cs integrated deposition was compared to soil
concentration measured within Fukushima prefecture on April
6th, 2011
(Fig 1,Fig 2).
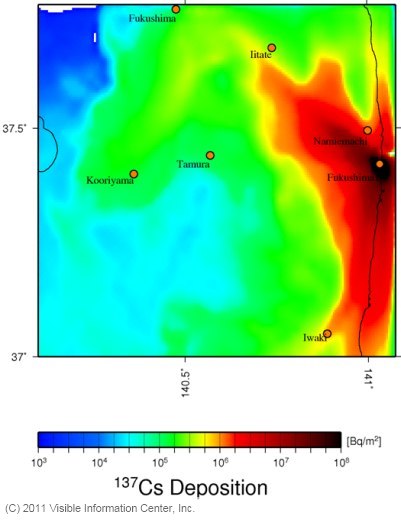
The soil concentration distribution of the simulation
reproduced the distribution in the vicinity of Iitate-mura and
Koriyama well. However, some discrepancy was found, for
example, simulation results showed relatively high
concentration while measured data was relatively small in the
vicinity of Iwaki.
Based on these simulation results and dust sample measurements,
reconsideration of release rate is ongoing. Although the
tendency of how radioactive plume dispersed will not
drastically change, absolute value might be changed by
reconsideration of source term.。
2. Conditions
|
Items |
Contents |
Reference |
|---|---|---|
|
Models |
Meteorological model:RAMS |
ATMET |
|
Period |
10:30 March 12th, 2011 - 0:00 April 6th |
|
|
Horizontal lattice |
Grid1:600×600[km]、10km mesh |
|
|
Vertical lattice |
σ-z coordinate system, Grid with 20km altitude divided into 30 layers |
|
|
Release point |
Fukushima Daiishi Nuclear Power Plant |
|
|
Source nuclide |
137Cs |
|
|
Release rate(※1) |
137Cs:1/10 of 131I |
|
|
Release height |
Normal:30m |
Press release |
|
Depositin velocity |
1.0[cm/s] |
|
|
Washout parameter α |
1.2×10⁻⁴ |
|
|
洗Washout parameter β |
0.8 |
|
|
Number of released particles |
ca. 25 million particles |
|
|
Meteorological data |
MSM (Meso Scale Model) isobaric surface data and AMeDAS precipitation(※2) |
Japan Meteorological Agency |
|
Topography data |
50m mesh numerical map |
Geospatial Information Authority of Japan |
※1:Based on dust sampling results at different places,
reconsideration is ongoing.
※2:Precipitation map made from AMeDAS data was derived and
applied because precipitation data produced by a meteorological
model was not sufficient.
3. Results
3.1 Comparison to measured data
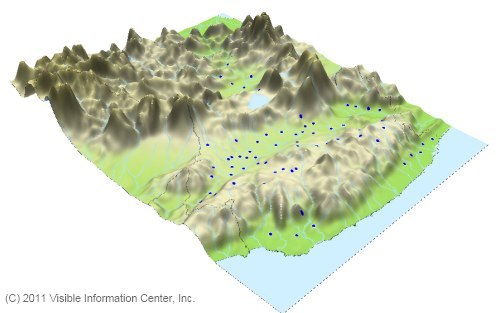
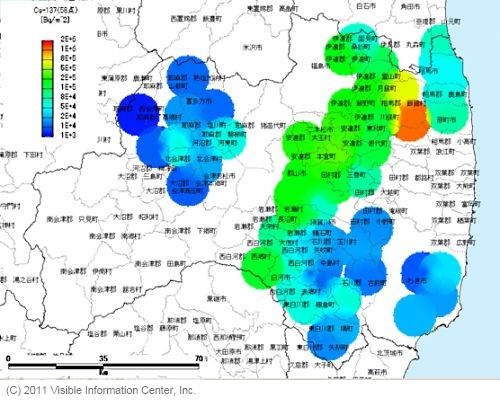
Comparison to measured data was conducted using soil concentration (publicly available) of each city in Fukushima prefecture measured by Fukushima prefecture government (See Fig.2). Measurement points are shown in Fig. 1.
|
|
|
(a) Measured soil concentration of 137Cs as of
April 6th, 2011. Rice paddy converted fields, (Bq/m2), Bulk density 1g/ml (assumption) |
(b) Calculated integrated deposition (from 10:00 March 12th
to 0:00 April 6th, 2011) |
|
Fig. 2 Comparison of 137Cs integrated deposition [Bq/m2] between measurement and calculation in Fukushima prefecture. |
|
![Calculated 137Cs integrated deposition [Bq/m^2] in the greater Tokyo area (from 10:00 March 12th to 0:00 April 6th, 2011)](./kanto-cs137-depo.jpg)
3.2 137Cs that reached the greater Tokyo area
Fig. 4 shows the time series of calculated integrated
deposition. This figure evidently shows 137Cs
deposition occurred from March 15th to 16th and March 21st in
the greater Tokyo area.
It is estimated that radioactive plume released from Fukushima
Daiichi Nuclear Power Plant passed the greater Tokyo area by
north wind and east wind from the Pacific Ocean on March 15th
(Refer to the concentration distribution).
Similar wind directions were observed on March 21st, with the
addition of rain in the greater Tokyo area.
Calculated time series of 137Cs ground level air
concentration at Kashiwa City Hall overlaid on measured
precipitation at nearest AMeDAS in Abiko is shown in
Fig.5.
The peaks of air concentration and precipitation were in good
agreement on March 21st in Fig. 5, therefore it suggests that
most of total amount of 137Cs deposited in Kashiwa
was caused by precipitation which occurred from 10:00 to 12:00,
March 21.
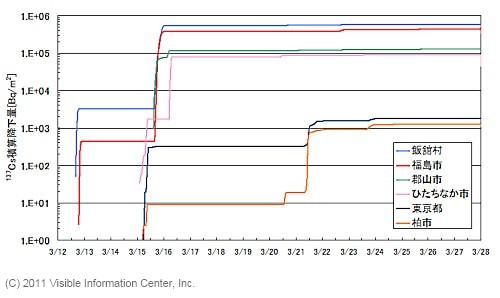
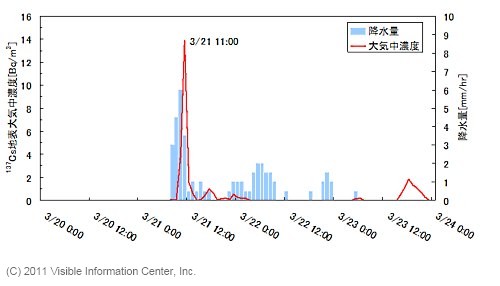
Fig. 5 Calculated 137Cs ground level air
concentration at Kashiwa City Hall and measured precipitation
at nearest AMeDAS in Abiko.
Revisions
| May 30th, 2011 | Misspelling corrected for Abiko in Japanese Kanji letters. |
|---|